
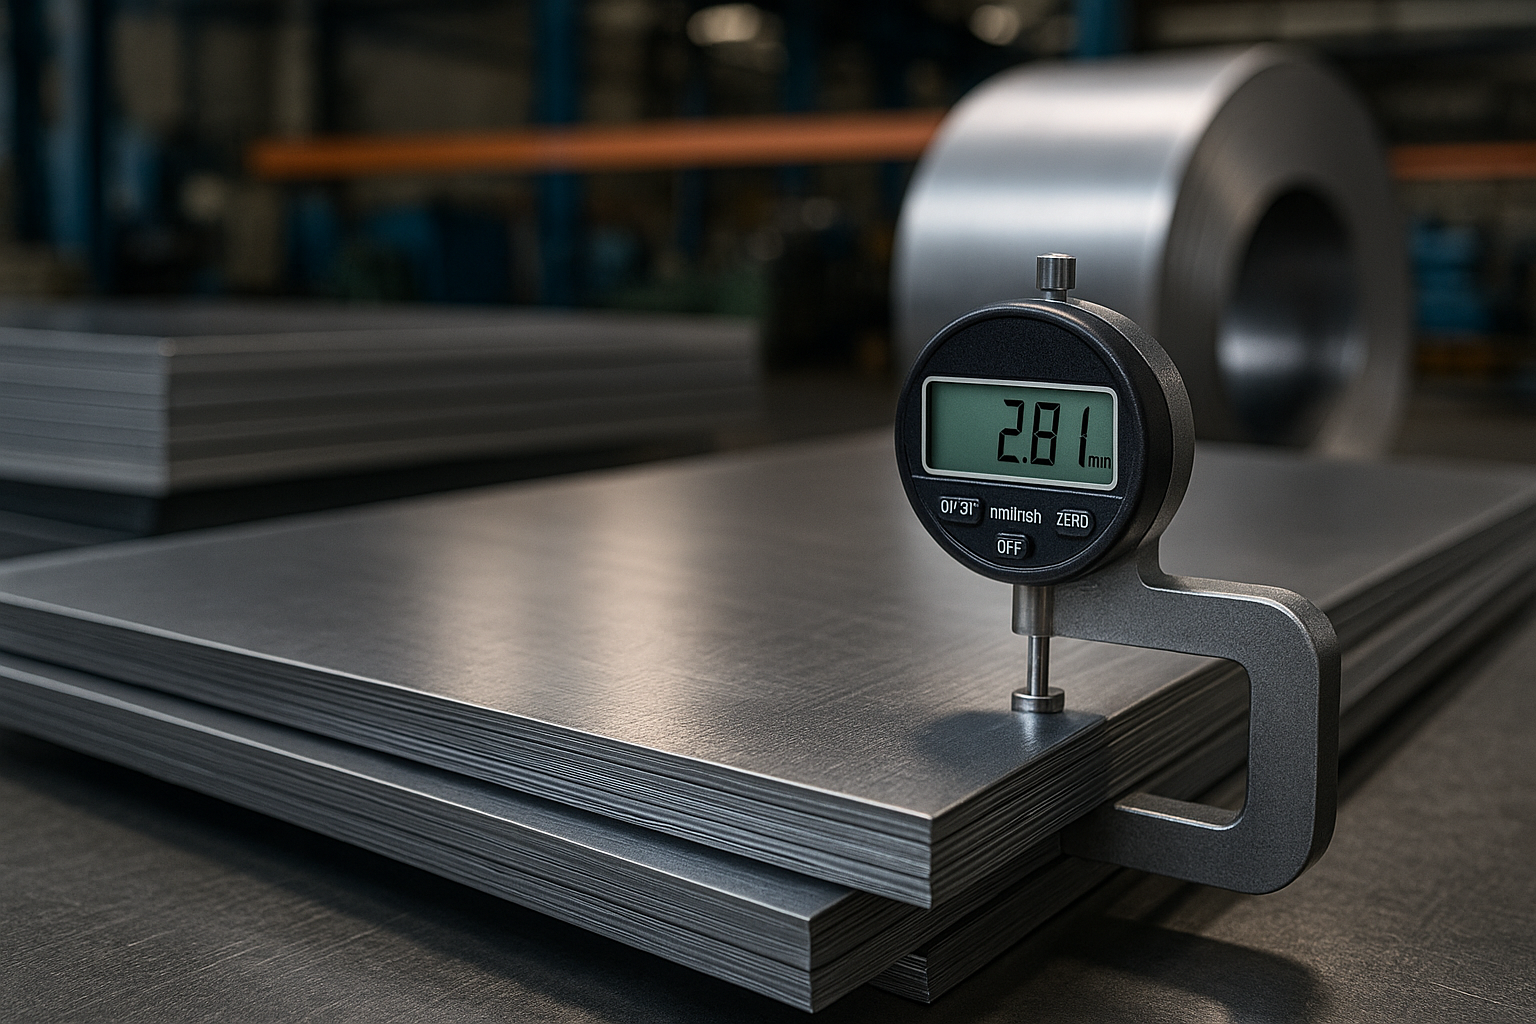
Weight Reduction vs. Thickness Tolerance in Steel Product Manufacturing
Steel cost reduction is often associated with negotiating lower prices, changing suppliers, or replacing one steel grade with another.
However, one of the most effective opportunities for reducing steel consumption can exist inside the dimensional specification itself: thickness tolerance.
In many steel products, the nominal thickness specified by the customer is not exactly the thickness delivered by the steel mill. Manufacturing standards normally permit dimensional variation around the nominal value.
If this variation is not properly understood and managed, a manufacturer may consistently purchase more steel mass than is technically necessary for the application.
A different approach is possible.
By analyzing the relationship between nominal thickness, permitted tolerance, actual delivered thickness, minimum functional thickness, mechanical properties, manufacturing capability, and supplier process control, companies can identify opportunities to reduce average steel consumption without compromising product performance.
This is fundamentally different from simply specifying a thinner steel.
It is a structured engineering and purchasing methodology.
For companies seeking to transform thickness optimization into a structured cost-reduction program, we developed a practical methodology for reducing steel consumption through thickness tolerance management, covering baseline analysis, statistical thickness distribution, supplier capability, technical validation, purchasing specifications, industrial trials, and continuous monitoring.
1. Why Thickness Has Such a Strong Impact on Steel Cost
For flat steel products, mass is directly related to thickness.
For a simplified rectangular steel sheet:
Mass = Length × Width × Thickness × Density
Using an approximate carbon steel density of 7,850 kg/m³, a sheet measuring 1,000 mm × 1,000 mm × 2.00 mm has a theoretical mass of approximately:
1 × 1 × 0.002 × 7,850 = 15.70 kg
If the actual average thickness is 2.10 mm instead of 2.00 mm:
1 × 1 × 0.0021 × 7,850 = 16.485 kg
That represents approximately 5% more steel mass.
For one component, the difference may appear insignificant.
Across thousands or millions of parts, however, it can become substantial.
This is why thickness control can become a strategic cost variable.
2. Nominal Thickness Is Not Necessarily Actual Thickness
A steel specification may indicate:
Nominal thickness = 2.00 mm
But the actual thickness delivered may vary within the limits permitted by the applicable standard, product specification, or commercial agreement.
This creates three different concepts that should not be confused:
Nominal thickness
The thickness used to designate the material.
Actual thickness
The thickness physically measured in the delivered steel.
Permitted thickness range
The dimensional variation accepted according to the applicable standard or purchasing specification.
This distinction is critical.
A company may believe it is consuming 2.00 mm steel while its actual historical average is consistently above the nominal value.
That additional material is incorporated into every manufactured component.
Whether it adds useful performance depends on the application and design requirements.
3. The Central Concept: Reduce Average Mass, Not Performance
Thickness optimization should never be interpreted as uncontrolled material reduction.
The objective is not:
“Make the steel as thin as possible.”
The correct objective is:
“Determine the lowest technically acceptable material condition that consistently satisfies all functional, manufacturing, safety, dimensional, and regulatory requirements.”
That distinction changes the entire methodology.
A successful program should evaluate at least:
- Nominal thickness
- Actual thickness distribution
- Permitted tolerances
- Minimum acceptable thickness
- Yield strength
- Tensile strength
- Elongation
- Formability
- Flatness
- Surface requirements
- Fatigue requirements
- Buckling
- Stiffness
- Welding behavior
- Corrosion allowance
- Manufacturing variation
Only after these factors are understood should a new thickness specification be implemented.
4. Thickness Tolerance Can Hide Material-Cost Opportunities
Consider a simplified example.
A manufacturer purchases steel specified at:
2.00 mm nominal thickness
Suppose historical incoming inspection shows an actual average of:
2.08 mm
If engineering analysis demonstrates that the product performs correctly at or near the nominal thickness and the applicable specification allows a controlled purchasing strategy, there may be an opportunity to reduce the average delivered thickness.
Assume that supplier qualification and revised dimensional requirements reduce the historical average from:
2.08 mm → 2.01 mm
The approximate material reduction would be:
(2.08 − 2.01) / 2.08 × 100 ≈ 3.37%
If annual steel consumption for these components is:
2,000 tonnes/year
the theoretical mass reduction would be approximately:
67 tonnes/year
without necessarily changing the nominal 2.00 mm designation.
This illustrates why tolerance management deserves attention in high-volume steel-consuming operations.
5. This Is Different from Gauge Reduction
Two strategies are frequently confused.
Strategy A — Gauge or nominal thickness reduction
Example:
2.00 mm → 1.80 mm
This is a design change.
It can significantly affect:
- Structural resistance
- Stiffness
- Buckling
- Fatigue
- Formability
- Weld design
- Fastening
- Vibration
- Impact performance
It normally requires engineering validation.
Strategy B — Thickness tolerance optimization
Example:
Maintain 2.00 mm nominal, but improve control over the actual delivered thickness distribution.
This may involve:
- Revised purchasing specifications
- Tighter tolerances
- Asymmetric tolerances where technically and contractually appropriate
- Supplier process capability
- Incoming inspection
- Statistical Process Control (SPC)
- Minimum-thickness requirements
The two strategies can also be combined, but they should be analyzed separately.
This distinction is fundamental for risk control.
6. Positive and Negative Thickness Tolerances
Suppose a hypothetical specification permits:
2.00 mm ± 0.10 mm
The acceptable range would be:
1.90 to 2.10 mm
If a supplier’s production process tends to operate toward the upper portion of this range, the buyer receives additional mass.
For example, a long-term average of 2.07 mm instead of 2.00 mm represents approximately 3.5% additional thickness.
From the supplier’s perspective, producing slightly above nominal may reduce the risk of delivering material below the minimum specification.
From the buyer’s perspective, however, the extra material may represent cost without corresponding functional value.
This creates an opportunity for collaboration.
The objective is not simply to force the supplier toward the lower tolerance limit.
It is to develop a process capable of operating closer to the technically appropriate target while maintaining sufficient statistical margin against nonconforming material.
7. Why Process Capability Matters
A supplier cannot safely target a lower average thickness if the rolling process has excessive variability.
Consider two suppliers.
Supplier A
Average thickness: 2.04 mm
Process variation: relatively high
Supplier B
Average thickness: 2.01 mm
Process variation: relatively low
Supplier B may be able to operate closer to the desired target while maintaining conformity because its process is more capable.
This is why thickness optimization should include statistical analysis.
Relevant indicators may include:
- Mean thickness
- Standard deviation
- Range
- Process capability
- Cp
- Cpk
- Frequency of measurements
- Coil-to-coil variation
- Within-coil variation
The goal is not merely a lower average.
It is a lower and statistically controlled average.
8. Start with Historical Consumption Data
Before changing specifications, companies should understand what they are currently receiving.
A practical analysis can begin with:
- Purchase records
- Material certificates
- Incoming inspection records
- Coil or sheet weights
- Actual thickness measurements
- Supplier data
- Production scrap
- Finished-product performance
The first important question is:
What thickness are we actually buying?
The second is:
What thickness does the product actually need?
The gap between those two answers may reveal the opportunity.
9. Establish the Technical Minimum
This is the most important engineering stage.
The minimum acceptable material condition cannot be established solely from purchasing data.
Engineering must determine the limiting requirements.
Depending on the component, these may include:
- Yield under static load
- Maximum deflection
- Local buckling
- Global buckling
- Fatigue life
- Impact resistance
- Torsional stiffness
- Formability
- Weld integrity
- Fastener performance
- Corrosion allowance
- Wear allowance
- Dimensional stability
For non-structural components, the limiting factor may not even be strength.
It may be:
- Panel stiffness
- Vibration
- Appearance
- Handling damage
- Forming stability
- Welding distortion
Therefore, each application requires its own technical evaluation.
10. Mechanical Properties Must Be Evaluated Together with Thickness
Thickness alone does not determine component performance.
Suppose a component is manufactured from a steel with a relatively low yield strength.
Replacing it with a higher-strength grade may create an opportunity for thickness reduction.
However:
Higher strength ≠ automatically thinner component
Other characteristics must be evaluated, including:
- Elastic modulus
- Elongation
- Bendability
- Hole expansion
- Fatigue behavior
- Weldability
- Springback
- Crash performance
- Local buckling
For example, changing from conventional mild steel to AHSS may permit significant mass reduction in some applications, but forming and joining processes may need to be redesigned.
Material grade and dimensional optimization should therefore be considered together.
11. Calculate the Financial Opportunity Before Starting
A preliminary economic calculation helps determine whether the project deserves engineering resources.
Suppose a company consumes:
5,000 tonnes of steel/year
If a technically validated tolerance program produces an average material reduction of only:
2%
the annual mass reduction would be:
100 tonnes
If the effective steel cost is:
$800/t
the direct material value would be approximately:
$80,000/year
And this does not yet include possible secondary savings from:
- Freight
- Handling
- Inventory
- Storage
- Scrap
- Energy
- Transportation of finished products
Small percentage reductions can therefore create meaningful results in high-volume operations.
12. Do Not Ignore the Cost of Tighter Tolerances
There is an important counterargument.
Steel mills or service centers may charge more for tighter dimensional tolerances.
Therefore, the project should not be evaluated simply as:
less weight = lower cost
The correct economic equation is closer to:
Net Benefit = Material Savings + Logistics Savings + Process Savings − Premium for Tighter Tolerance − Validation Costs − Additional Inspection Costs
For example, if a tighter tolerance reduces steel consumption by 3% but increases purchase price by 4%, the project may not be economically attractive.
On the other hand, a 1% price premium combined with a 4% reduction in effective material consumption may create significant value.
The decision must be based on total economics.
13. Supplier Negotiation Is Critical
Traditional steel negotiations often focus almost exclusively on:
$/tonne
Thickness optimization introduces another dimension:
kg of steel required per finished component
This can change the purchasing discussion.
Instead of asking only:
What is your price per tonne?
the buyer can also ask:
What is your process capability for thickness?
and:
What average thickness distribution can you reliably supply while meeting the required minimum?
A slightly more expensive supplier with superior thickness control may ultimately provide a lower material cost per finished part.
This is an important procurement concept.
14. Cost per Part Is Often More Important Than Cost per Tonne
Consider two hypothetical suppliers.
Supplier A
Steel price: $780/t
Average delivered thickness: 2.07 mm
Supplier B
Steel price: $795/t
Average delivered thickness: 2.00 mm
Supplier A appears cheaper by:
$15/t
But the additional average thickness is approximately:
3.5%
Depending on how the material is purchased, processed, and converted into finished components, Supplier B may produce a more favorable cost per useful part.
This is why steel purchasing should sometimes be evaluated using:
material cost per finished component
rather than only:
material price per tonne
15. Applications with High Potential
Thickness optimization can be particularly attractive in industries with high steel consumption and repetitive components.
Examples include:
Automotive
- Brackets
- Reinforcements
- Body components
- Structural parts
- Seats
- Chassis components
Agricultural equipment
- Guards
- Panels
- Housings
- Platforms
- Structural assemblies
Trailers and semi-trailers
- Side structures
- Floors
- Supports
- Cross-members
- Panels
Steel furniture
- Cabinets
- Shelving
- Lockers
- Desks
- Storage systems
HVAC and appliances
- Cabinets
- Covers
- Internal structures
- Panels
General metalworking
- Enclosures
- Brackets
- Frames
- Guards
- Fabricated components
The highest opportunities are usually found where relatively small dimensional improvements are multiplied across very high production volumes.
16. Manufacturing Must Be Revalidated
Even when engineering calculations indicate that a lower thickness is acceptable, manufacturing behavior must be verified.
Potential effects include:
Stamping and forming
Reduced thickness can change:
- Springback
- Forming forces
- Wrinkling
- Dimensional stability
- Tool behavior
Welding
Changes may be required in:
- Current
- Voltage
- Travel speed
- Heat input
- Weld schedules
Laser cutting
Different thicknesses may require different cutting parameters.
Press braking
Bending force, tooling selection, bend allowance, and springback compensation may change.
Fastening
Rivets, bolts, clinching, and other joining systems should also be validated.
This is why pilot production is essential.
17. Incoming Inspection Becomes Strategic
Once a thickness optimization program is implemented, incoming inspection becomes part of the economic control system.
Inspection should verify:
- Actual thickness
- Measurement location
- Coil variation
- Sheet variation
- Flatness
- Width
- Surface condition
- Mechanical properties where applicable
- Material identification
- Traceability
Measurement equipment should be appropriate and calibrated.
The objective is to confirm that the supplier is consistently delivering the agreed material condition.
18. Develop an Internal Thickness Specification
Companies with significant steel consumption can benefit from developing their own internal purchasing standards.
Such a standard may define:
- Applicable steel grades
- Nominal thicknesses
- Permitted tolerances
- Minimum acceptable thickness
- Measurement methodology
- Sampling frequency
- Mechanical-property requirements
- Flatness requirements
- Surface requirements
- Certificate requirements
- Traceability
- Nonconformity procedures
The internal specification should complement—not improperly override—the applicable technical standards, customer requirements, regulatory obligations, and engineering design criteria.
This creates consistency between engineering, purchasing, quality, production, and suppliers.
19. A Practical Implementation Methodology
A structured thickness optimization project can follow these stages.
Stage 1 — Identify high-consumption items
Prioritize components with:
- High annual tonnage
- High production volume
- Stable designs
- Repetitive manufacturing
- Multiple qualified suppliers
Stage 2 — Measure the current condition
Determine:
- Nominal thickness
- Actual average
- Variation
- Supplier capability
- Annual consumption
- Current cost
Stage 3 — Determine technical requirements
Engineering establishes the functional limits.
Stage 4 — Calculate theoretical savings
Estimate potential mass and financial reduction.
Stage 5 — Define the proposed specification
Establish target thickness and tolerance requirements.
Stage 6 — Qualify suppliers
Verify that suppliers can consistently meet the new specification.
Stage 7 — Conduct production trials
Test forming, welding, assembly, dimensional behavior, and final performance.
Stage 8 — Validate the product
Complete the necessary engineering and quality validation.
Stage 9 — Implement controlled production
Introduce the specification under monitored conditions.
Stage 10 — Measure actual savings
Compare:
Before vs. After
using real purchasing and production data.
20. Before-and-After Measurement
A thickness optimization project should produce measurable results.
A useful dashboard can include:
| Indicator | Before | After |
|---|---|---|
| Nominal thickness | — | — |
| Average actual thickness | — | — |
| Standard deviation | — | — |
| Steel consumption per part | — | — |
| Annual steel consumption | — | — |
| Steel cost per part | — | — |
| Scrap rate | — | — |
| Supplier nonconformities | — | — |
| Finished-product performance | — | — |
This transforms the project from an engineering hypothesis into a verified cost-reduction program.
21. Weight Reduction Creates Secondary Benefits
Direct material savings are only the first effect.
Lower component mass can also reduce:
- Internal handling effort
- Freight costs
- Vehicle weight
- Packaging requirements
- Energy consumption in mobile equipment
- Finished-product transportation emissions
For trailers, trucks, agricultural equipment, and other mobile applications, reduced tare weight may also create additional operational value.
In certain applications, every kilogram removed from the equipment can potentially contribute to payload or efficiency.
22. Sustainability Benefits Should Be Calculated Carefully
Reducing unnecessary steel consumption can reduce lifecycle environmental impact because less material must be:
- Produced
- Transported
- Processed
- Stored
- Incorporated into the product
However, environmental claims should be based on appropriate data.
Instead of assuming one universal CO₂ value per tonne of steel, companies should preferably use:
- Supplier-specific Environmental Product Declarations (EPDs)
- Verified product carbon footprint data
- Production-route information
- Recognized lifecycle databases
The carbon intensity of steel varies considerably depending on production route, energy source, scrap content, and plant technology.
Therefore, material reduction is a strong sustainability strategy, but emissions savings should be calculated using defensible data.
23. When Thickness Optimization Should Not Be Used
Not every component is a good candidate.
Extra caution is necessary for:
- Safety-critical components
- Pressure-containing equipment
- Fatigue-sensitive structures
- Components governed by minimum code thickness
- Severe corrosion environments
- Wear-critical applications
- Customer-controlled specifications
- Certified structural systems
In these cases, dimensional changes may require formal engineering approval, testing, customer authorization, or regulatory review.
The methodology should never bypass applicable engineering requirements.
24. Common Mistakes
Reducing nominal thickness without engineering analysis
This converts a controlled optimization project into an unnecessary technical risk.
Looking only at mill tolerance tables
The standard tells you what may be supplied. It does not necessarily tell you what your application requires.
Targeting the minimum tolerance limit
A process needs statistical margin. The target should account for variability.
Ignoring mechanical properties
Thickness and material strength must be evaluated together.
Selecting suppliers only by $/tonne
Cost per useful component can tell a different story.
Implementing without pilot trials
Manufacturing behavior may change even when structural calculations are satisfactory.
Failing to measure the result
Without before-and-after data, savings cannot be reliably demonstrated.
25. Digital Technologies Are Making Thickness Control More Powerful
Modern steel manufacturing increasingly uses automated thickness measurement and process control.
Technologies include:
X-ray and isotope gauges
Used for continuous thickness measurement in rolling lines.
Laser measurement
Supports high-speed dimensional inspection.
Statistical Process Control
Identifies process drift before material becomes nonconforming.
Artificial Intelligence
Machine-learning systems can analyze production patterns and support process optimization.
Manufacturing data integration
ERP, MES, quality systems, and supplier data can be integrated to compare purchased steel mass with actual component consumption.
The result is a shift from tolerance as a passive specification to tolerance as an actively managed production variable.
26. Thickness Tolerance as a Strategic Procurement Variable
The broader lesson extends beyond engineering.
Steel buyers traditionally negotiate:
- Price
- Payment terms
- Volume
- Delivery
- Freight
Advanced procurement can also negotiate:
- Dimensional capability
- Thickness distribution
- Mechanical-property consistency
- Surface quality
- Flatness
- Packaging
- Traceability
This moves steel purchasing from commodity negotiation toward technical procurement.
And technical procurement can uncover savings that conventional price negotiation cannot.
Frequently Asked Questions
Is thickness tolerance optimization the same as reducing nominal thickness?
No. Reducing nominal thickness is a design change. Thickness tolerance optimization can reduce average material consumption while maintaining the nominal specification, depending on the applicable standard and technical requirements.
Can tighter tolerances increase steel prices?
Yes. Mills and service centers may charge premiums for special dimensional requirements. The premium must be compared with the resulting material and process savings.
Should the target thickness be the minimum permitted thickness?
Generally, no. Manufacturing processes have variation. The target should provide adequate statistical margin to consistently meet the minimum requirement.
Can thickness optimization be applied to structural components?
Potentially, but structural and safety-critical components require appropriate engineering validation and compliance with all applicable standards and design requirements.
How should suppliers be evaluated?
In addition to price, evaluate process capability, actual thickness distribution, mechanical-property consistency, certification, quality systems, traceability, and delivery reliability.
What is the main financial metric?
For many applications, steel cost per finished component provides more useful information than steel price per tonne alone.
Conclusion: Thickness Tolerance Is More Than a Dimensional Requirement
Thickness tolerance is often treated simply as a quality-control requirement.
For steel-intensive manufacturers, it can be much more.
When engineering, purchasing, quality, manufacturing, and suppliers work together, thickness control can become a systematic method for reducing unnecessary material consumption.
The methodology is not based on making products thinner without analysis.
It is based on understanding:
what the product requires, what the standard permits, what the supplier actually delivers, and what the manufacturing process can consistently control.
The opportunity can then be quantified, tested, implemented, and monitored.
In high-volume manufacturing, even small reductions in average steel consumption can generate significant annual savings.
More importantly, the methodology creates a repeatable approach that combines:
- Engineering validation
- Material optimization
- Supplier development
- Statistical process control
- Cost reduction
- Sustainability
- Manufacturing reliability
The most efficient steel component is not necessarily the one manufactured from the thinnest material.
It is the component that uses only the amount of steel technically required to perform its function reliably throughout its intended service life.
That is the real relationship between weight reduction and thickness tolerance.